A feisty sequence in Monday’s game between the Toronto Maple Leafs and Tampa Bay Lightning has re-opened some old wounds across certain fanbases (mostly the home team’s, if we’re being honest). A knee-on-knee hit on Dakota Mermis by Tampa Bay forward Gage Goncalves, followed by a scrum which included a high stick to the helmet of Oliver Bjorkstrand by Toronto forward Bobby McMann, ended both players’ nights – Goncalves getting a Game Misconduct, and McMann a Match Penalty.
This surprised many, who hadn’t seen McMann’s high stick in the moment. But, rules are rules, and even if it looked like McMann was just trying to slash downwards and caught helmet by accident, he still caught helmet.
Where the surprise came was the next day, when McMann’s automatic review turned into a one-game suspension, and Goncalves’ hit, which has since been confirmed to take Mermis out for “at least a month” by Leafs coach Craig Berube, did not recieve any supplmental discipline. It was pointed out by many that a similar (if not more vicious) stick swat by Jacob Trouba in 2023 recieved a $5000 fine, and that the only case of an errant swat out of a scrum receiving a suspension was Pierre Engvall, also of the Maple Leafs, in 2022.
This talk led to people asking me about an old chart I’d made, identifying how many times and for how many games players have been suspended for since George Parros took over the NHL’s Department of Player Safety in 2017/18.
As such, I’ve updated the chart. Like before, it doesn’t include automatic suspensions, off-ice incidents, or preseason games. As an extra reference, I’ve included how many times teams have received game misconducts / match penalties in that time, along with minor penalties, to see if what Player Safety notices is in line with what the on-ice officials notice in game.
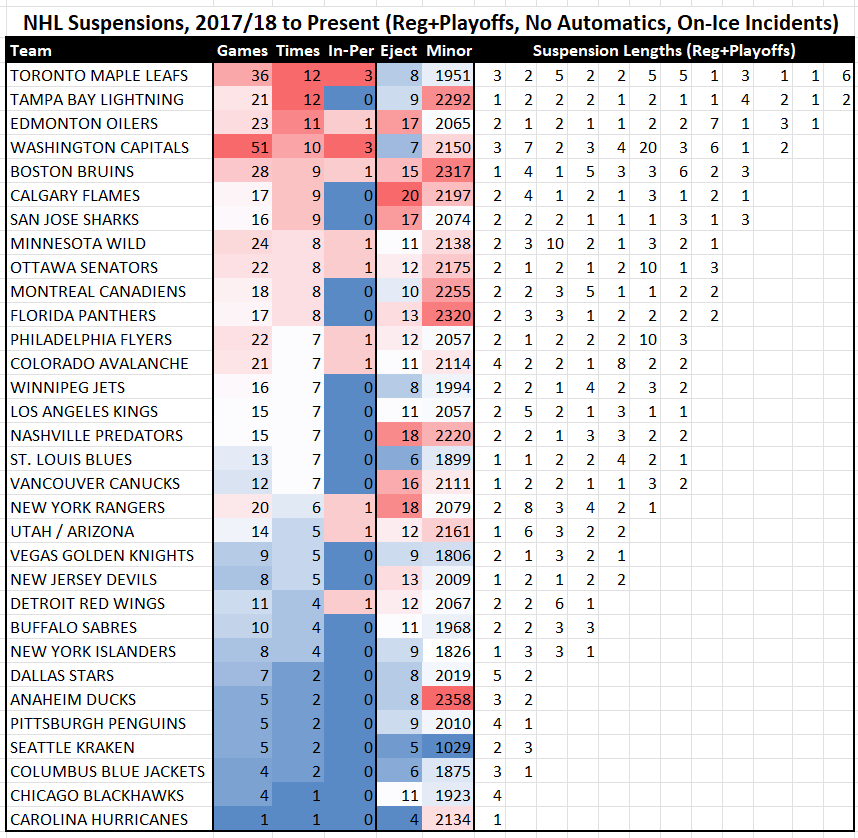
At the time, Toronto were the team with the most individual suspensions. Until Monday, they’d briefly lost that crown to the Tampa Bay Lightning, but the McMann ruling and Goncalves non-punishment moved them back into a tie for the 1-seed, which they break on total games.
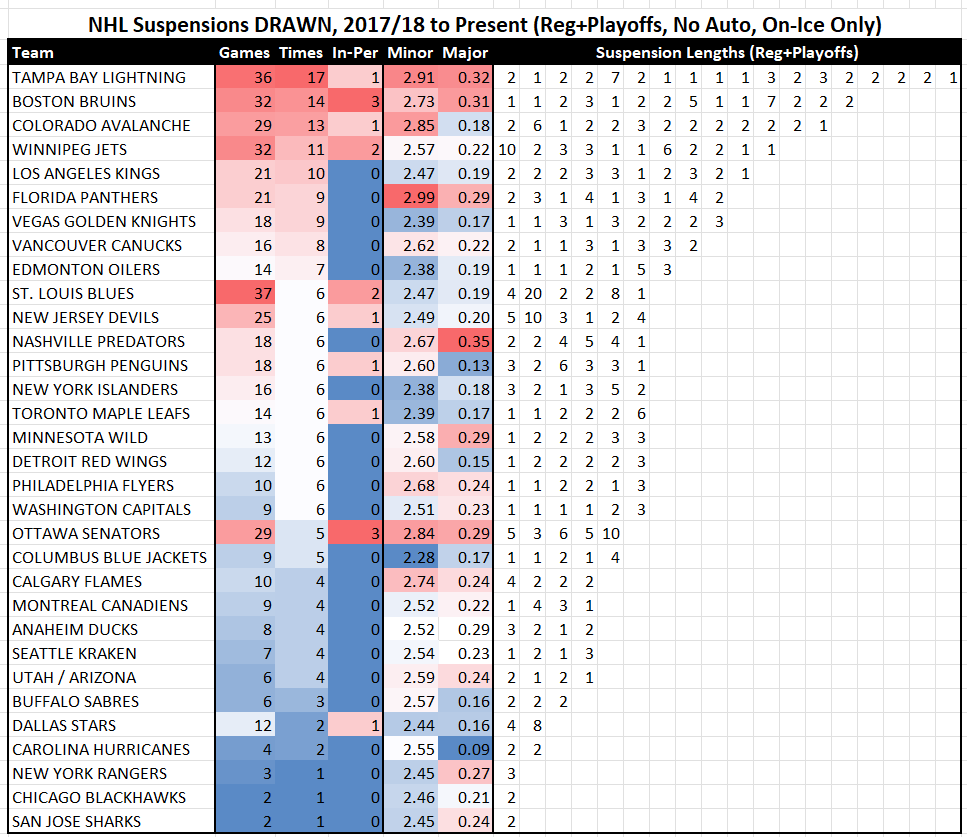
Ass well, I’ve never really looked at the victim’s side of the coin, to see which teams have been on the receiving end of incidents deemed suspension worthy. Since the league doesn’t have the ejections plainly labelled, I used Evolving Hockey’s minor/major penalties drawn per game rates as the bonus columns.
Lastly, I’ve combined the two charts to see which teams have the “best” differential, meaning they’ve been targeted more than they’ve been the targeters.
I don’t have a strong conclusion to hold in tow here as for why teams are where they are. Maybe some teams really are just dirtier, more vulnerable, or some combination of one or the other. I do know one popular theory in Toronto is that Parros has it in for the team since his career-ending injury came in a fight against the Leafs. I don’t believe that’s the case, personally, or that he has a specific vendetta against them at all.
Where there might be some juice towards a bias, though, is in visibility. It does still seem weird that Toronto is the most-suspended team and does pretty poorly in the aggregate, but they’re also the team that are most likely to make the news cycle if they do something that crosses the line. With the way that broadcasts focus on a single team, having a negative differential doesn’t necessarily dispute that – if you’re always discussing an incident from the perspective of the focus team, the victim can become more of a story than their aggressor, allowing an opponent to skirt scrutiny.
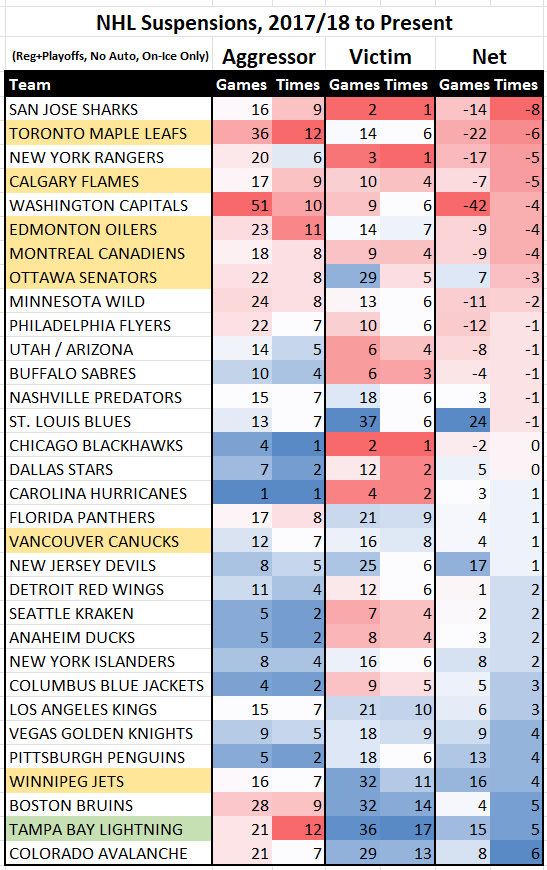
Five of Canada’s seven teams being in the bottom seven in net suspensions feels particularly fascinating with this in mind. I noticed in putting together the “drawn” list that an abnormal amount of Canadian teams’ drawn suspensions – 18 of 45 – came when Canadian team was the aggressor. That’s 40% of the suspensions from fewer than 20% of the opponents. Even when accounting for the fact that some play in each other’s division, you’re still arriving at the same share, if not fewer, of games. So, “how likely is this guy going to be talked about on SportsCentre or Hockey Night in Canada” probably plays a bigger factor in these rulings than we care to admit.
I’m also fascinated by Tampa Bay’s presence as both the 1B most-suspended team and the team with the most drawn suspensions. I’ve talked for many years about them being a team that loves to drive the temperature up in games, knowing that their potent special teams will help them win out in the aggregate. Others, like Boston around the same time and Florida in the past few seasons, have replicated this, with the latter even using it against their state rival innovators. The data here seems to flesh with that at the most extreme level as much as it does with regular penalties.
(Also, does nothing mean happen in Blackhawks games?)
From this point, I’ll leave the rest of what’s here up for your own personal interpretations, but it was fun to put together again nonetheless.
Leave a Reply